18 Polar Coordinates
Learning Objectives
In this section, you will:
- Plot points using polar coordinates.
- Convert from polar coordinates to rectangular coordinates.
- Convert from rectangular coordinates to polar coordinates.
- Transform equations between polar and rectangular forms.
- Identify and graph polar equations by converting to rectangular equations.
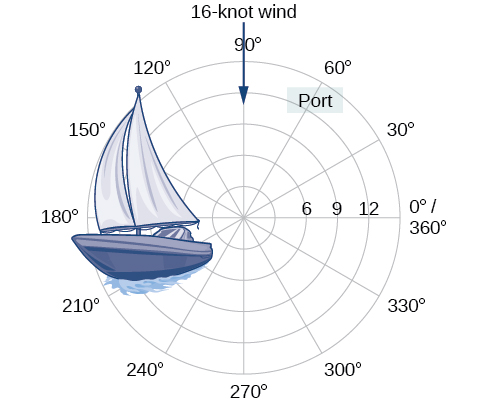
Over 12 kilometers from port, a sailboat encounters rough weather and is blown off course by a 16-knot wind (see (Figure 1)). How can the sailor indicate his location to the Coast Guard? In this section, we will investigate a method of representing location that is different from a standard coordinate grid.
Plotting Points Using Polar Coordinates
When we think about plotting points in the plane, we usually think of rectangular coordinates  in the Cartesian coordinate plane. However, there are other ways of writing a coordinate pair and other types of grid systems. In this section, we introduce polar coordinates, which are points labeled
  and plotted on a polar grid. The polar grid is represented as a series of concentric circles radiating out from the pole, or the origin of the coordinate plane.
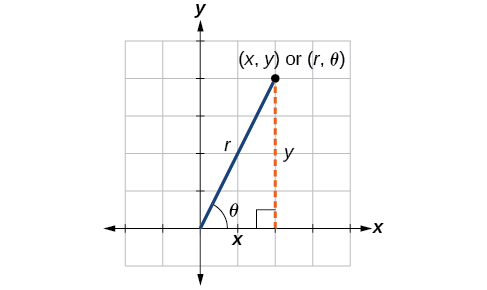
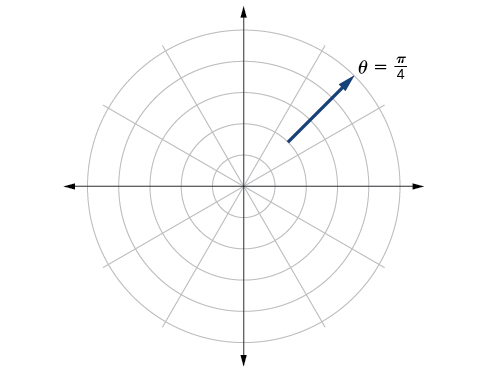
The polar grid is scaled as the unit circle with the positive x-axis now viewed as the polar axis and the origin as the pole. The first coordinate  is the radius or length of the directed line segment from the pole. The angle
 measured in radians, indicates the direction of
  We move counterclockwise from the polar axis by an angle ofand measure a distance r along a directed line segment in the direction of
  Even though we measure
  first and then
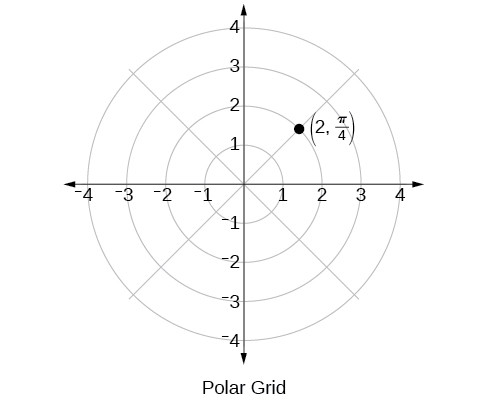
  the polar point is written with the r-coordinate first. For example, to plot the point
  we would move
  units in the counterclockwise direction and then a length of 2 from the pole. This point is plotted on the grid in (Figure 2).
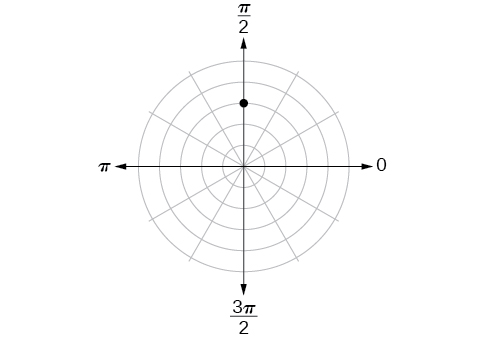
Plotting a Point on the Polar Grid
Plot the point on the polar grid.
Show Solution
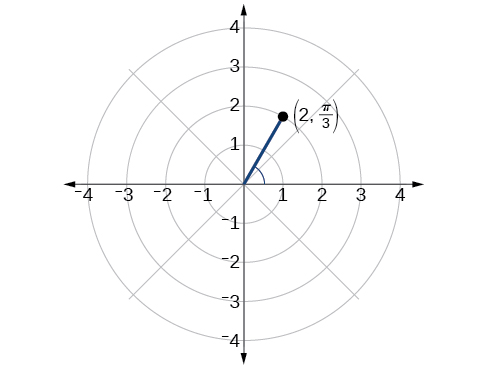
The angle  is found by sweeping in a counterclockwise direction 90° from the polar axis. The point is located at a length of 3 units from the pole in the direction, as shown in (Figure 3).

Try It
Plot the point  in the polar grid.
Show Solution
Plotting a Point in the Polar Coordinate System with a Negative Component
Plot the point on the polar grid.
Show Solution
We know that  is located in the first quadrant. However,
  We can approach plotting a point with a negative in two ways:
- Plot the point
 by moving
 in the counterclockwise direction and extending a directed line segment 2 units into the first quadrant. Then retrace the directed line segment back through the pole, and continue 2 units into the third quadrant;
 - Move in the counterclockwise direction, and draw the directed line segment from the pole 2 units in the negative direction, into the third quadrant.
See (Figure 4)(a). Compare this to the graph of the polar coordinate shown in (Figure 4)(b).

Try It
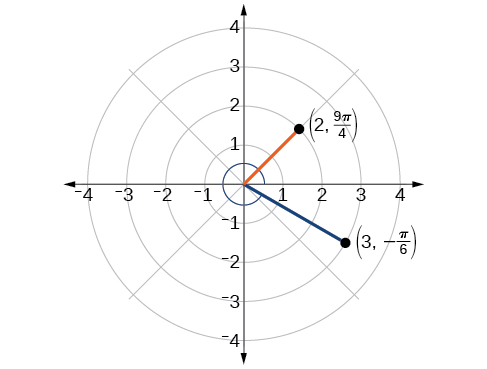
Plot the points  and
and  on the same polar grid.
Show Solution
Converting from Polar Coordinates to Rectangular Coordinates
When given a set of polar coordinates, we may need to convert them to rectangular coordinates. To do so, we can recall the relationships that exist among the variables  and
and 

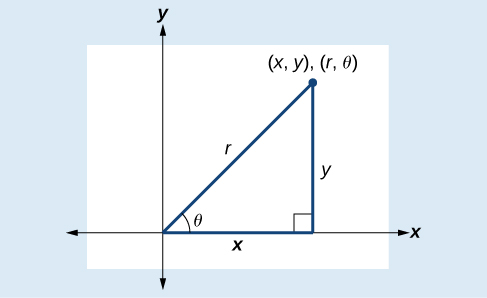
Dropping a perpendicular from the point in the plane to the x-axis forms a right triangle, as illustrated in (Figure 5). An easy way to remember the equations above is to think of  as the adjacent side over the hypotenuse and
  as the opposite side over the hypotenuse.
Converting from Polar Coordinates to Rectangular Coordinates
To convert polar coordinates  to rectangular coordinates
 let
let
How To
Given polar coordinates, convert to rectangular coordinates.
- Given the polar coordinate
 write
write  and
and 
- Evaluate and

- Multiply b y to find the x-coordinate of the rectangular form.
- Multiply by to find the y-coordinate of the rectangular form.
Writing Polar Coordinates as Rectangular Coordinates
Write the polar coordinates as rectangular coordinates.
Show Solution
Use the equivalent relationships.

The rectangular coordinates are  See (Figure 6).

Writing Polar Coordinates as Rectangular Coordinates
Write the polar coordinates  as rectangular coordinates.
Show Solution
See (Figure 7). Writing the polar coordinates as rectangular, we have

The rectangular coordinates are also 

Try It
Write the polar coordinates  as rectangular coordinates.
Show Solution

Converting from Rectangular Coordinates to Polar Coordinates
To convert rectangular coordinates to polar coordinates, we will use two other familiar relationships. With this conversion, however, we need to be aware that a set of rectangular coordinates will yield more than one polar point.
Converting from Rectangular Coordinates to Polar Coordinates
Converting from rectangular coordinates to polar coordinates requires the use of one or more of the relationships illustrated in (Figure 8).

Writing Rectangular Coordinates as Polar Coordinates
Convert the rectangular coordinates  to polar coordinates.
Show Solution
We see that the original point is in the first quadrant. To find  use the formula
  This gives

To find  we substitute the values for
  and
and  into the formula
  We know that must be positive, as is in the first quadrant. Thus

So,  and
and  giving us the polar point
  See (Figure 9).

Analysis
There are other sets of polar coordinates that will be the same as our first solution. For example, the points  and
and  will coincide with the original solution of
  The point indicates a move further counterclockwise by
  which is directly opposite
  The radius is expressed as
  However, the angle
  is located in the third quadrant and, as is negative, we extend the directed line segment in the opposite direction, into the first quadrant. This is the same point as
  The point
  is a move further clockwise by
  from The radius,
  is the same.
Transforming Equations between Polar and Rectangular Forms
We can now convert coordinates between polar and rectangular form. Converting equations can be more difficult, but it can be beneficial to be able to convert between the two forms. Since there are a number of polar equations that cannot be expressed clearly in Cartesian form, and vice versa, we can use the same procedures we used to convert points between the coordinate systems. We can then use a graphing calculator to graph either the rectangular form or the polar form of the equation.
How To
Given an equation in polar form, graph it using a graphing calculator.
- Change the MODE to POL, representing polar form.
- Press the Y= button to bring up a screen allowing the input of six equations:

- Enter the polar equation, set equal to

- Press GRAPH.
Writing a Cartesian Equation in Polar Form
Write the Cartesian equation  in polar form.
Show Solution
The goal is to eliminate and from the equation and introduce and Ideally, we would write the equation as a function of To obtain the polar form, we will use the relationships between and  Since
Since and
and  we can substitute and solve for

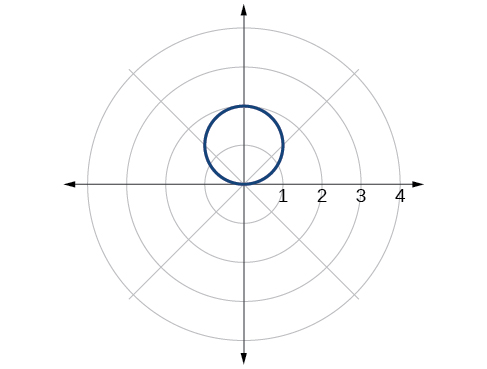
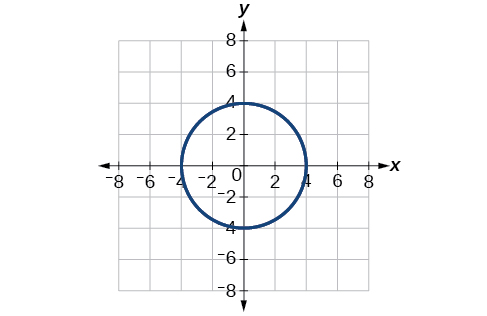
Thus,  and
and  should generate the same graph. See (Figure 10).
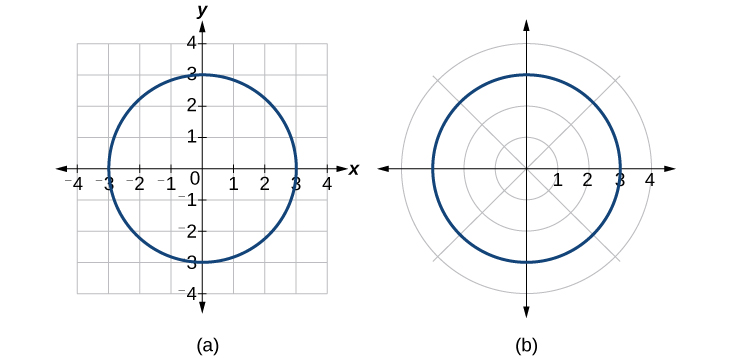 (b) Polar form
To graph a circle in rectangular form, we must first solve for 

Note that this is two separate functions, since a circle fails the vertical line test. Therefore, we need to enter the positive and negative square roots into the calculator separately, as two equations in the form  and
and  Press GRAPH.
Rewriting a Cartesian Equation as a Polar Equation
Rewrite the Cartesian equation  as a polar equation.
Show Solution
This equation appears similar to the previous example, but it requires different steps to convert the equation.
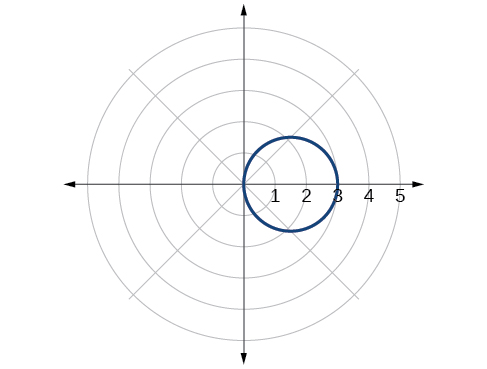
We can still follow the same procedures we have already learned and make the following substitutions:

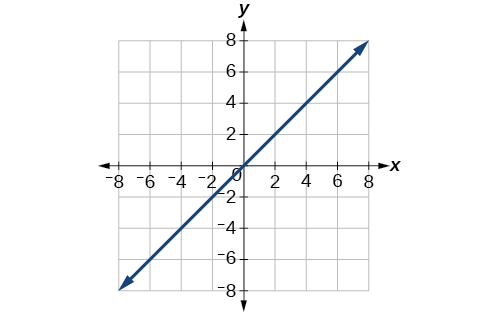
Therefore, the equations  and
and  gives us the same graph. See (Figure).
 (b) polar form
The Cartesian or rectangular equation is plotted on the rectangular grid, and the polar equation is plotted on the polar grid. Clearly, the graphs are identical.
Rewriting a Cartesian Equation in Polar Form
Rewrite the Cartesian equation as a polar equation.
Show Solution
We will use the relationships  and
and 

Try It
Rewrite the Cartesian equation  in polar form.
Show Solution

Identify and Graph Polar Equations by Converting to Rectangular Equations
We have learned how to convert rectangular coordinates to polar coordinates, and we have seen that the points are indeed the same. We have also transformed polar equations to rectangular equations and vice versa. Now we will demonstrate that their graphs, while drawn on different grids, are identical.
Graphing a Polar Equation by Converting to a Rectangular Equation
Covert the polar equation  to a rectangular equation, and draw its corresponding graph.
Show Solution
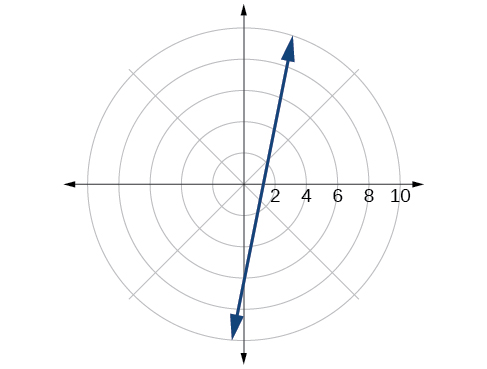
The conversion is

Notice that the equation  drawn on the polar grid is clearly the same as the vertical line
  drawn on the rectangular grid (see (Figure 12)). Just as
  is the standard form for a vertical line in rectangular form,
  is the standard form for a vertical line in polar form.

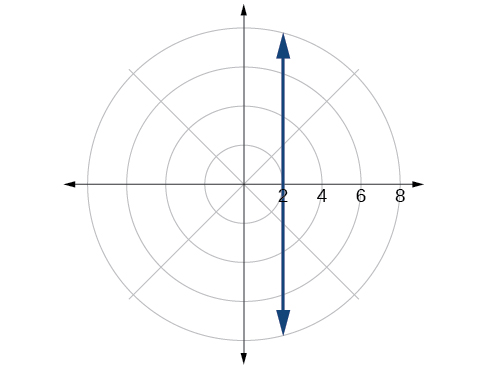
A similar discussion would demonstrate that the graph of the function  will be the horizontal line
  In fact,
  is the standard form for a horizontal line in polar form, corresponding to the rectangular form
Rewriting a Polar Equation in Cartesian Form
Rewrite the polar equation  as a Cartesian equation.
Show Solution
The goal is to eliminate and and introduce and  We clear the fraction, and then use substitution. In order to replace with and
  we must use the expression

The Cartesian equation is  However, to graph it, especially using a graphing calculator or computer program, we want to isolate

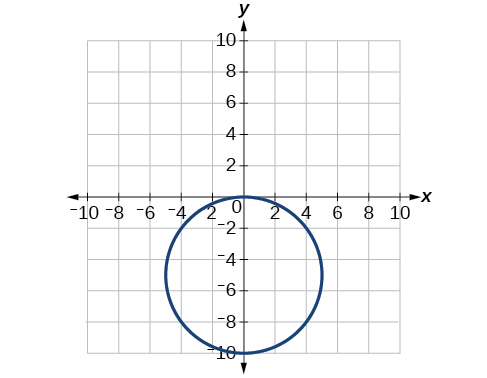
When our entire equation has been changed from and to and  we can stop, unless asked to solve for or simplify. See (Figure 13).

The “hour-glass” shape of the graph is called a hyperbola. Hyperbolas have many interesting geometric features and applications, which can be investigated further in Analytic Geometry.
Analysis
In this example, the right side of the equation can be expanded and the equation simplified further, as shown above. However, the equation cannot be written as a single function in Cartesian form. We may wish to write the rectangular equation in the hyperbola’s standard form. To do this, we can start with the initial equation.

Try It
Rewrite the polar equation in Cartesian form.
Show Solution
 or, in the standard form for a circle,
Rewriting a Polar Equation in Cartesian Form
Rewrite the polar equation in Cartesian form.
Show Solution

This equation can also be written as

Access these online resources for additional instruction and practice with polar coordinates.
Key Equations
| Conversion formulas |  |
Key Concepts
- The polar grid is represented as a series of concentric circles radiating out from the pole, or origin.
- To plot a point in the form
 move in a counterclockwise direction from the polar axis by an angle of and then extend a directed line segment from the pole the length of in the direction of Ifis negative, move in a clockwise direction, and extend a directed line segment the length of in the direction of See (Figure 3).
 - If is negative, extend the directed line segment in the opposite direction of See (Figure 4).
- To convert from polar coordinates to rectangular coordinates, use the formulas
 and
and  See (Figure 6) and (Figure 7).
 - To convert from rectangular coordinates to polar coordinates, use one or more of the formulas:
 and See (Figure 9).
 - Transforming equations between polar and rectangular forms means making the appropriate substitutions based on the available formulas, together with algebraic manipulations. See (Figure 10), (Figure 11), and (Figure).
- Using the appropriate substitutions makes it possible to rewrite a polar equation as a rectangular equation, and then graph it in the rectangular plane. See (Figure 12), (Figure 13), and (Figure).
Section Exercises
Verbal
How are polar coordinates different from rectangular coordinates?
Show Solution
For polar coordinates, the point in the plane depends on the angle from the positive x-axis and distance from the origin, while in Cartesian coordinates, the point represents the horizontal and vertical distances from the origin. For each point in the coordinate plane, there is one representation, but for each point in the polar plane, there are infinite representations.
How are the polar axes different from the x– and y-axes of the Cartesian plane?
Explain how polar coordinates are graphed.
Show Solution
Determine for the point, then move units from the pole to plot the point. If is negative, move units from the pole in the opposite direction but along the same angle. The point is a distance of away from the origin at an angle of from the polar axis.
How are the points latex]\,\left(3,\frac{\pi }{2}\right)\,[/latex] and  in polar coordinates related?
Explain why the points  and
and  are the same in polar coordinates.
Show Solution
The point has a positive angle but a negative radius and is plotted by moving to an angle of and then moving 3 units in the negative direction. This places the point 3 units down the negative y-axis. The point has a negative angle and a positive radius and is plotted by first moving to an angle of  and then moving 3 units down, which is the positive direction for a negative angle. The point is also 3 units down the negative y-axis.
Algebraic
For the following exercises, convert the given polar coordinates to Cartesian coordinates with  and
and  Remember to consider the quadrant in which the given point is located when determining
  for the point.


Show Solution


Show Solution


For the following exercises, convert the given Cartesian coordinates to polar coordinates with  Remember to consider the quadrant in which the given point is located.

Show Solution


Show Solution


Show Solution

For the following exercises, convert the given Cartesian equation to a polar equation.


Show Solution


Show Solution
![r=\sqrt[3]{\frac{sin\theta }{2co{s}^{4}\theta }}](https://university.pressbooks.pub/app/uploads/quicklatex/quicklatex.com-9963dc76a0b9c269f869d83fff1f3da2_l3.png "Rendered by QuickLaTeX.com")


Show Solution


Show Solution


Show Solution


Show Solution

For the following exercises, convert the given polar equation to a Cartesian equation. Write in the standard form of a conic if possible, and identify the conic section represented.


Show Solution
 or
or  circle


Show Solution
 line
line


Show Solution
 line
line


Show Solution
 hyperbola


Show Solution
 circle


Show Solution
 line
line
Graphical
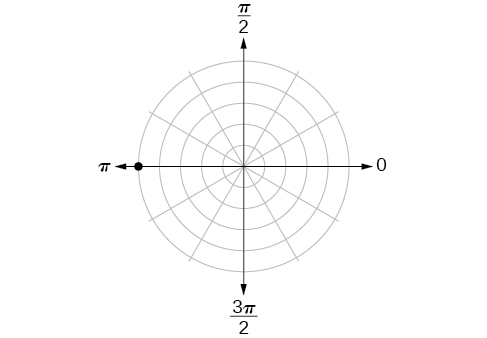
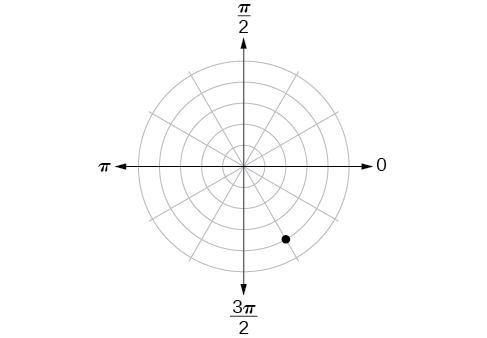
For the following exercises, find the polar coordinates of the point.
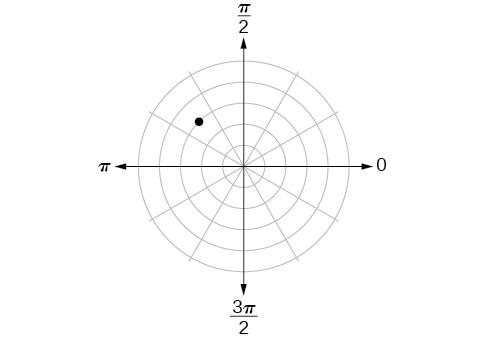
Show Solution

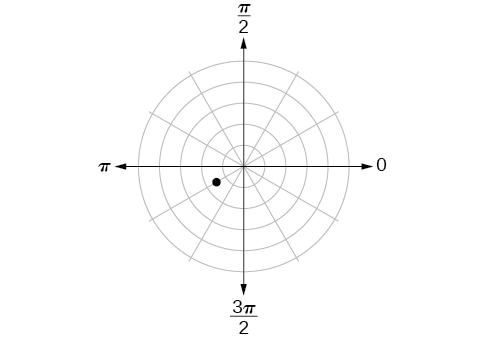
Show Solution
For the following exercises, plot the polar points.

Show Solution


Show Solution


Show Solution


Show Solution


Show Solution


For the following exercises, convert the equation from rectangular to polar form and graph on the polar axis.

Show Solution


Show Solution


Show Solution


Show Solution
For the following exercises, convert the equation from polar to rectangular form and graph on the rectangular plane.


Show Solution


Show Solution


Show Solution


Technology
Use a graphing calculator to find the rectangular coordinates of  Round to the nearest thousandth.
Show Solution

Use a graphing calculator to find the rectangular coordinates of Round to the nearest thousandth.
Use a graphing calculator to find the polar coordinates of in degrees. Round to the nearest thousandth.
Show Solution

Use a graphing calculator to find the polar coordinates of  in degrees. Round to the nearest hundredth.
Use a graphing calculator to find the polar coordinates of in radians. Round to the nearest hundredth.
Show Solution

Extensions
Describe the graph of 
Describe the graph of 
Show Solution
A vertical line with  units left of the y-axis.
Describe the graph of 
Describe the graph of 
Show Solution
A horizontal line with units below the x-axis.
What polar equations will give an oblique line?
For the following exercise, graph the polar inequality.

Show Solution
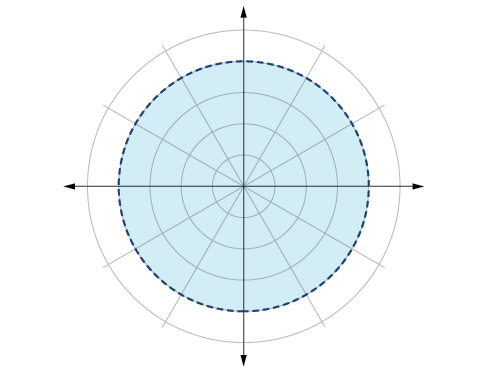


Show Solution


Show Solution

Glossary
- polar axis
- on the polar grid, the equivalent of the positive x-axis on the rectangular grid
- polar coordinates
- on the polar grid, the coordinates of a point labeled
 whereindicates the angle of rotation from the polar axis andrepresents the radius, or the distance of the point from the pole in the direction of
- pole
- the origin of the polar grid
